KPIs and Dashboards for Monitoring Large Language Model Health
Why LLM Health Monitoring Isn’t Optional Anymore
If your large language model (LLM) is making up facts, slowing down responses, or costing more than expected, you’re not alone. In 2025, over 67% of enterprises using LLMs in production have already implemented dedicated monitoring systems. Why? Because without it, your AI can quietly erode customer trust, violate compliance rules, or drain your budget-all without anyone noticing until it’s too late.
Traditional ML monitoring tools were built for classification tasks: Is this email spam or not? Did the model predict the right category? But LLMs generate open-ended text. They don’t just classify-they create. And that changes everything. A model that’s 90% accurate on a test set might still be generating dangerous misinformation in real user chats. That’s why monitoring LLM health requires a new kind of dashboard-one that tracks not just technical performance, but real-world impact.
Four Dimensions of LLM Health You Must Track
Effective LLM monitoring breaks down into four core areas. Ignore any one, and you’re flying blind.
Model Quality: Are You Getting Truth or Fiction?
This is where most organizations fail. You need to measure what your model actually says, not just how fast it says it.
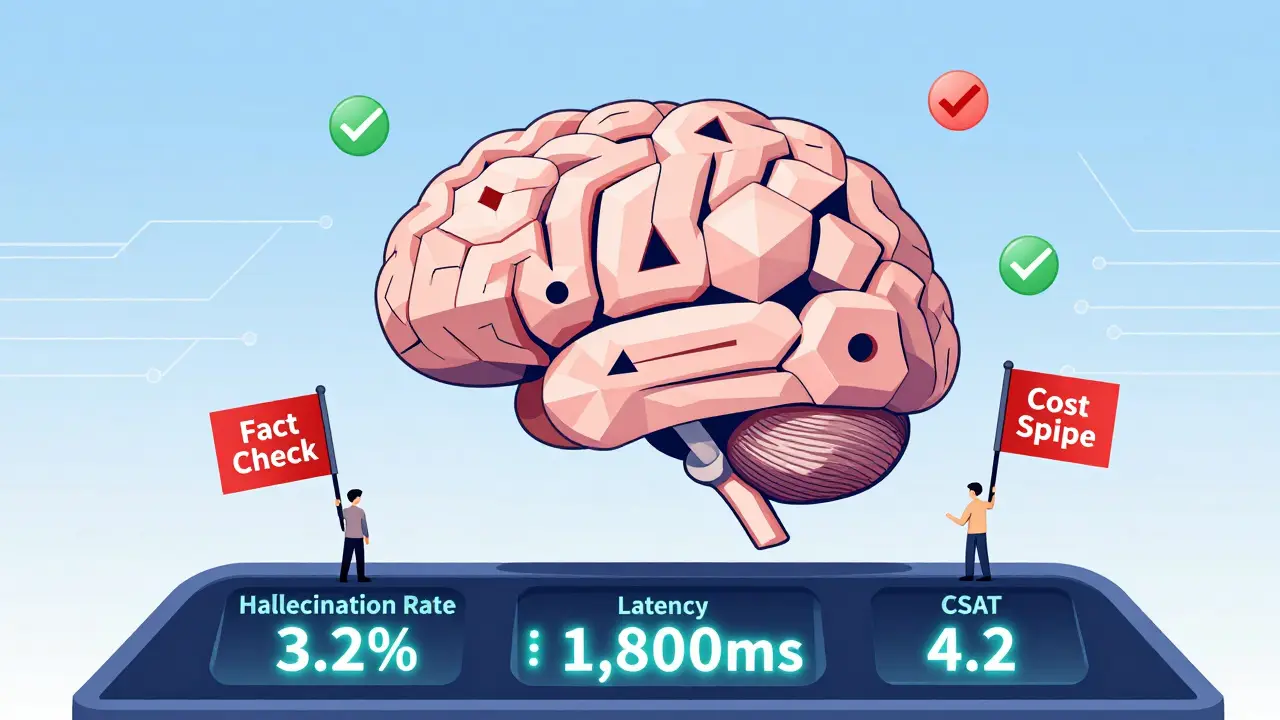
- Hallucination rate: The percentage of responses containing facts not supported by the input context. Top performers keep this below 5% in critical applications like healthcare or finance.
- Groundedness: How often does the model stick to the provided source material? A score below 70% means it’s making up answers.
- Coherence and fluency: Rated by human evaluators on a 1-5 scale. A score under 3.5 means users are getting confused or frustrated.
- Safety: What percentage of outputs contain harmful, biased, or toxic content? In regulated industries, this must be under 0.1%.
One hospital system found their diagnostic assistant was hallucinating drug interactions in 12% of cases. That’s not a bug-it’s a liability. They implemented automated fact-checking against medical databases and cut hallucinations to 3.2% in six weeks.
Operational Efficiency: Is Your Model Running Smoothly?
Speed and cost matter. A slow model kills user engagement. An expensive one kills your budget.
- Latency: Time from user input to first response. Anything over 2,000ms leads to a 22% drop in completion rates, according to AWS data.
- Throughput: Requests per second and tokens processed per minute. If your system can’t handle peak loads, users get timeouts.
- GPU/TPU utilization: Are your accelerators running at 80%+? If they’re under 40%, you’re wasting money.
- Serving nodes: How many servers are handling requests? Too many = high cost. Too few = crashes.
One SaaS company noticed their average response time jumped from 1,850ms to 3,200ms. A deep dive showed 82% of the delay was in model inference-not data prep. They switched to a smaller, fine-tuned model and cut latency by 42%.
Cost Management: Are You Spending Wisely?
LLMs aren’t free. You pay per token. And tokens add up fast.
- Cost per token: Measured in USD per 1,000 tokens. For GPT-4, this is around $0.06. For smaller models, it’s $0.002.
- Monthly spend: Track trends. A 15% spike without a usage increase means something’s wrong.
- Optimization rate: How much have you reduced costs without hurting quality? Leading teams achieve 30-40% savings through caching, model selection, and prompt engineering.
Organizations that monitor cost per token at 5-minute intervals are 3x more likely to catch runaway spending before it hits $10,000 in a single day.
User Engagement: Are People Actually Getting Value?
Technical metrics mean nothing if users don’t use the system-or if they leave because it’s unreliable.
- Completion rate: What % of user sessions result in a full interaction? If it’s below 60%, users are quitting.
- Customer satisfaction (CSAT): Survey users after each interaction. A 10% drop in hallucinations can lift CSAT by 7.2%, according to Codiste.
- Feedback volume: Are users flagging errors? High feedback = high trust. Low feedback = silent frustration.
One financial advisor tool saw a 40% increase in user retention after they added a simple "Was this helpful?" button and tied responses to KPIs. Users felt heard-and the model improved faster.
How Dashboards Turn Data Into Decisions
A dashboard isn’t just a pretty chart. It’s your early warning system.
Best-in-class LLM dashboards do three things:
- Correlate metrics: Show how latency spikes correlate with drops in CSAT or spikes in hallucinations.
- Set smart alerts: Don’t alert on every glitch. Alert when a 15% increase in hallucinations happens AND user complaints rise. That’s a real problem.
- Highlight root causes: Instead of saying "model performance dropped," say "hallucinations spiked after last deployment on 12/10 due to prompt template change."
Google Cloud’s latest update lets you predict business impact: "If hallucinations rise 10%, customer satisfaction will drop by 8.3% over the next 7 days." That’s not just monitoring-it’s foresight.

Industry-Specific KPIs: One Size Doesn’t Fit All
Healthcare, finance, and retail don’t care about the same things.
Healthcare: Safety First
Here, KPIs are life-or-death:
- Diagnostic accuracy vs. gold-standard medical records
- Bias detection across race, gender, and age groups
- Compliance with HIPAA: 22% more data validation checks than general systems
Censinet’s system automated audit trails from EHRs and cut compliance audit time by 40%. One hospital resolved 87% of potential violations within 2 hours-down from 72 hours manually.
Finance: Compliance and Explainability
- Audit trail completeness: Every decision must be traceable
- Regulatory adherence score: How well does output match SEC or FINRA guidelines?
- Explainability: Can a human understand why the model suggested a loan denial?
MIT Sloan documented a cardiac risk model that didn’t just predict death risk-it became a KPI. Doctors used it to track how patient risk changed after medication changes. That’s the goal: AI as a decision partner, not a black box.
Customer Service: Speed + Accuracy
- First-contact resolution rate
- Escalation rate to human agents
- Response tone alignment (is it too robotic? too casual?)
Companies with high CSAT scores use customized alerts: one team gets notified if sentiment drops below 3.8, another if escalation rate hits 15%. No one-size-fits-all.
Common Pitfalls and How to Avoid Them
Most teams fail not because the tech is hard-but because they skip the basics.
Pitfall 1: No Ground Truth
You can’t measure accuracy if you don’t know what correct looks like.
Solution: Use 3-5 human reviewers per 100 samples. Label responses as "accurate," "partially correct," or "hallucinated." Over time, this becomes your benchmark.
Pitfall 2: Too Many Alerts
50 alerts a day? No one pays attention.
Solution: Tier your alerts. Green = monitor. Yellow = review by end of day. Red = stop the deployment now. Only 3-5 alerts should be red.
Pitfall 3: Monitoring Only Tech, Not Business
Tracking latency alone is like checking your car’s RPM without looking at the gas gauge.
Solution: Every KPI must link to a business outcome. Example: "If latency exceeds 2,000ms, user completion drops by 22%-so we trigger an alert." That’s actionable.
Pitfall 4: Ignoring Cost
LLMs are expensive. Monitoring adds 12-18% to infrastructure costs.
Solution: Monitor cost per token in real time. Use cheaper models for low-risk tasks. Cache common responses. Every 1% reduction in token use saves $1,500/month at scale.
What Tools Are Out There?
You don’t have to build everything from scratch.
- Google Cloud Vertex AI Monitoring: Strong in healthcare, integrates with clinical systems, 210% YoY growth in 2024.
- Arize and WhyLabs: Specialized in ML observability. Great for fine-tuning alerts and drift detection.
- Datadog and Splunk: Expand from traditional APM to include LLM metrics. Good if you already use them.
- Open-source (Prometheus + Grafana): Free but requires heavy customization. Only for teams with ML engineers.
For most enterprises, a cloud-native solution with pre-built LLM metrics is the fastest path to value.
Where Is This All Headed?
The future isn’t just monitoring-it’s predicting.
- Predictive drift detection: Beta systems can forecast hallucination spikes 24-48 hours in advance with 73% accuracy.
- Causal AI: By 2026, 80% of tools will tell you why a KPI changed-not just that it did.
- Business impact forecasting: "If we reduce latency by 300ms, we’ll gain 5,000 additional monthly active users." That’s the new standard.
But here’s the catch: only 32% of organizations use consistent metrics across projects. Without standardization, you can’t compare, learn, or scale.
Start Here: Your First 30-Day Plan
Don’t try to monitor everything. Start small.
- Week 1: Pick one critical use case (e.g., customer support chatbot).
- Week 2: Define 3 KPIs: hallucination rate, latency, and user satisfaction.
- Week 3: Set up alerts: Red if hallucinations > 8%, latency > 2,500ms, CSAT < 3.5.
- Week 4: Review data weekly. Ask: "What did we learn? What changed? What should we fix?"
By day 30, you’ll know if your model is helping-or hurting. And that’s more than most companies can say.
- Jul, 29 2025
- Collin Pace
- 8
- Permalink
Written by Collin Pace
View all posts by: Collin Pace