LLM Inference Observability: Token Metrics, Queues, and Tail Latency

You deployed your Large Language Model (LLM). It works great in staging. Then you push it to production, and suddenly users complain that responses feel "laggy," even though your dashboard shows green lights across the board. What gives? The problem isn't usually broken code; it's invisible infrastructure dynamics. Specifically, it’s about how tokens flow through queues and how a few slow requests drag down the entire system.
LLM observability is the practice of monitoring and understanding the behavior of LLM inference systems in production by combining metrics, logs, and events. Unlike traditional web apps where every request does roughly the same amount of work, LLMs are wildly variable. One user asks for a one-word answer; another asks for a 2,000-word essay. If you only watch requests per second (RPS), you’re missing the real story. You need to look at token throughput, queue depths, and-most critically-tail latency.
Why Requests Per Second Is a Lie
In standard microservices, RPS is a decent proxy for load. If RPS spikes, you scale up. But with LLM inference, this metric breaks because the computational cost per request varies drastically based on token count. A request generating 50 tokens might take 100ms, while one generating 500 tokens could take 2 seconds.
If your dashboard shows stable RPS but your users are timing out, your system is likely saturated by long-output requests. This is why modern frameworks like vLLM and TGI (Text Generation Inference) don’t just export request counts. They export specific token-level telemetry. You must track:
- Prompt Tokens: The input size. Larger prompts increase prefill time.
- Completion Tokens: The output size. This drives generation time.
- Total Token Throughput: The actual measure of system capacity.
Ignoring these leads to "silent saturation." Your CPU/GPU looks busy, but your effective throughput has collapsed because the engine is stuck processing massive context windows or long generations. Always monitor tgi_request_generated_tokens or gen_ai.client.token.usage alongside RPS.
The Holy Trinity of Latency Metrics
Latency in LLMs isn't a single number. It’s a sequence of distinct phases, each with its own failure modes. To fix user experience issues, you need to break down the total response time into three critical components: Time-to-First-Token (TTFT), Inter-Token Latency (ITL), and End-to-End Latency.
Time-to-First-Token (TTFT)
Time-to-First-Token (TTFT) is the initial latency before the first token appears in the stream. This is the metric that determines if your app feels "instant" or "frozen." When TTFT jumps from milliseconds to seconds, users perceive the system as broken, even if the final answer arrives quickly.
Research from Glean indicates a direct correlation between input size and delay: for every additional input token, P95 TTFT increases by approximately 0.24ms. This seems small until you realize a 10,000-token prompt adds nearly 2.4 seconds to the wait time just to start. If your TTFT exceeds 50-100ms, users will click away. Monitor vllm:time_to_first_token_seconds closely. A sudden spike here often signals GPU memory pressure or inefficient batching.
Inter-Token Latency (ITL)
Once the first token arrives, the speed at which subsequent tokens appear defines the "flow" of the conversation. Inter-Token Latency measures the time between consecutive token generations. High ITL makes text appear choppy or fragmented. Even if the total request completes in 5 seconds, high ITL makes it feel sluggish compared to a smooth stream.
This metric is sensitive to batch contention. If your server is trying to process too many concurrent requests, the scheduler may starve some streams, causing gaps in token delivery. Track gen_ai.server.time_per_output_token histograms. If the median is fine but the p99 is terrible, you have scheduling jitter.
End-to-End Latency
This is the total wall-clock time from request initiation to completion. While important for SLAs, it’s often misleading on its own. A request can have excellent TTFT and ITL but still take forever if the model generates an unexpectedly long response. Use end-to-end metrics like tgi_request_duration primarily for billing and timeout enforcement, not for diagnosing UX issues.

Queuing Theory: The Hidden Killer
Most performance degradation in LLM inference comes from queuing, not raw compute power. Because output lengths follow a heavy-tailed distribution (a few requests generate massive outputs), they block the pipeline for everyone else. This is modeled effectively using M/G/1 queueing theory.
Imagine a highway where most cars are sedans, but occasionally a semi-truck enters. If the road is full, the truck blocks all lanes behind it. In LLM terms, a request asking for a 2,000-token summary sits in the active batch, consuming resources and delaying new requests. This creates a feedback loop: longer queues lead to higher waiting times, which causes impatient users to abandon requests, further skewing your data.
| Queue State | Observed Metric Behavior | User Impact | Action Required |
|---|---|---|---|
| Low Utilization | Low TTFT, Low Queue Depth | Instant response | None |
| Moderate Load | Rising TTFT, Stable ITL | Slight delay before start | Monitor trends |
| Saturation | High TTFT, Spiking Queue Size | Perceived freezing | Scale replicas or limit max tokens |
| Overload | Timeouts, High Error Rates | Request failures | Load shedding or autoscaling |
To mitigate this, you must monitor queue wait time and batch size. BentoML and TGI expose these explicitly. If queue depth grows consistently, you have two choices: add more hardware (scale out) or cap the maximum output tokens. Capping tokens reduces the variance in service time, smoothing out the queue at the cost of potentially truncating long answers. For most chat applications, a hard limit of 1,024-2,048 tokens is a safe trade-off to maintain low tail latency.
Mastering Tail Latency (P95/P99)
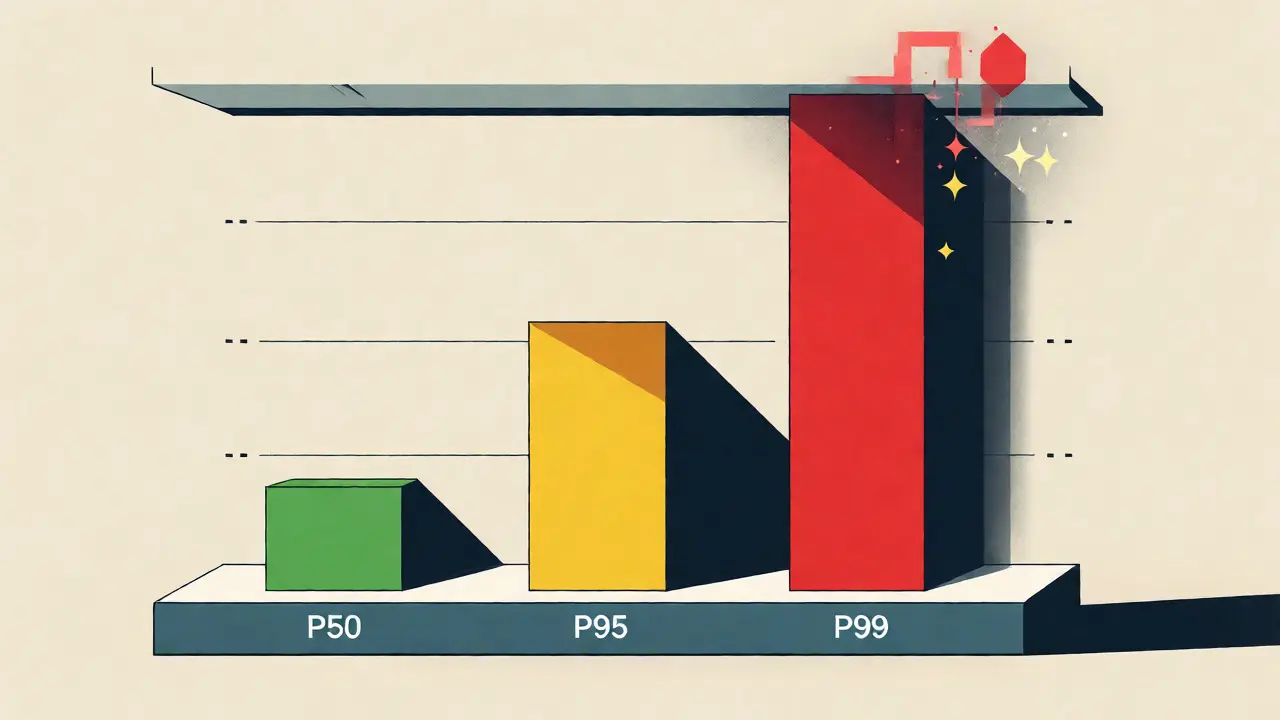
Averages lie. If your average latency is 200ms, but 5% of your users wait 5 seconds, those users are churning. In distributed systems, we care about the 95th (P95) and 99th (P99) percentiles. LogicMonitor’s AI Observability guide rightly notes: "Nobody cares about your average if the 99th percentile is terrible."
Tail latency in LLMs is driven by three factors:
- Cold Starts: Loading models into GPU memory takes time. Ensure warm pools exist.
- Memory Fragmentation: As KV caches fill and empty, memory fragmentation can slow down allocation.
- Long-Tail Generations: As discussed, outlier requests hogging the batch.
Your observability stack must visualize these percentiles over time. Don’t just plot the mean. Plot P50, P95, and P99 for TTFT and ITL separately. If P99 TTFT is 2x P50, you have a consistency problem. Investigate whether specific large prompts or complex tool calls are causing these spikes.
Implementing a Robust Observability Stack
So, what should you actually build? Modern standards like OpenTelemetry for GenAI provide semantic conventions (gen_ai.*) that make this easier. Here’s a practical checklist for your infrastructure team:
- Instrument Token Counts: Log prompt and completion tokens for every request. Aggregate by user and feature to spot cost anomalies.
- Expose Histograms: Never use simple counters for latency. Use histograms to calculate accurate percentiles across multiple instances.
- Track Queue Metrics: Monitor pending requests and active batch sizes. Alert when queue depth exceeds a threshold (e.g., >50 requests).
- Correlate Cost and Latency: Long generations cost more and take longer. Link these metrics to identify expensive, slow features.
- Set SLOs on TTFT: Define a strict Service Level Objective for Time-to-First-Token (e.g., 95% of requests < 500ms). Alert when breached.
Tools like LangChain and Braintrust help capture higher-level metadata (like feedback scores), but for infrastructure health, stick to Prometheus-compatible exports from vLLM or TGI. These give you the raw signal needed to tune your deployment parameters.
Next Steps for Production Stability
Observability isn't a one-time setup. It’s an iterative tuning process. Start by establishing baselines for your current traffic patterns. Identify your P95 TTFT and average token consumption. Then, experiment with configuration changes-such as adjusting max batch size or implementing dynamic token limits-and observe their impact on tail latency.
Remember, the goal isn't just to see what happened; it's to predict what will happen next. By watching token throughput and queue depths, you can preemptively scale resources before users notice a slowdown. In the world of LLMs, visibility is velocity.
What is the difference between TTFT and End-to-End Latency?
Time-to-First-Token (TTFT) measures the delay before the first character appears, impacting perceived responsiveness. End-to-End Latency measures the total time from request start to full response completion. A system can have fast TTFT but slow End-to-End latency if the model generates very long outputs slowly.
Why do my requests-per-second metrics look stable while latency spikes?
This happens because LLM workload variability is high. A few requests with massive input/output token counts consume disproportionate resources, blocking the queue. While the count of requests remains steady, the computational load (token throughput) surges, causing delays for other users.
How does queueing affect LLM inference performance?
LLM inference uses continuous batching. If long-running requests occupy the batch slots, new requests must wait in the queue. Heavy-tailed distributions of output lengths mean occasional long generations significantly increase average queue wait times, leading to higher tail latency.
What is a good target for Time-to-First-Token (TTFT)?
For interactive applications, aim for sub-500ms P95 TTFT. For seamless experiences, sub-100ms is ideal. However, thresholds depend on context; background tasks can tolerate higher TTFT than real-time chat interfaces.
Should I monitor averages or percentiles for LLM latency?
Always prioritize percentiles (P95, P99). Averages hide outliers. Since user experience is defined by the worst-case scenarios they encounter, tail latency metrics provide a much more accurate picture of system health and satisfaction.
- Oct, 1 2026
- Collin Pace
- 0
- Permalink
Written by Collin Pace
View all posts by: Collin Pace