Measuring Hallucination Rate in Production LLM Systems: Metrics and Dashboards

You built a chatbot. It sounds smart. It flows well. But last Tuesday, it told a customer that your return policy is 90 days when it’s actually 30. That’s not just a bug; that’s a hallucination. In the early days of Large Language Models (LLMs), we celebrated fluency. Now, in late 2026, fluency is cheap. Reliability is expensive. If you’re running an LLM in production-whether it’s a customer support agent or a financial analyst tool-you can’t afford to guess how often it lies to your users.
Here’s the hard truth: traditional metrics like BLEU or ROUGE are useless for this. A model can score perfectly on those while making up facts half the time. You need specific tools to measure Hallucination Rate the frequency with which an LLM generates information that contradicts provided context or established facts. This guide breaks down exactly how to measure it, what dashboards actually work, and how to set thresholds that don’t break your business.
Why Standard Metrics Fail at Factuality
If you look at most open-source evaluation suites, you’ll see scores for "coherence" and "relevance." These are nice-to-haves. They don’t tell you if the answer is true. An arXiv survey from October 2025 highlighted a scary stat: models scoring 95+ on standard linguistic metrics still hallucinated 40% of the time in factual tasks. Why? Because these metrics measure form, not content.
Think of it like a student who writes beautifully but fails every history exam because they invented dates. To fix this, you need metrics that check claims against source data. This is where RAGAS Faithfulness a metric measuring the fraction of claims in an LLM response that are supported by the retrieved context comes in. It doesn’t care if the sentence is pretty. It cares if every claim has a receipt.
| Metric | Best For | Performance (AUROC/F1) | Cost/Latency |
|---|---|---|---|
| Semantic Entropy | Real-time filtering | ~0.79 AUROC | Low (Self-evaluation) |
| RAGAS Faithfulness | RAG systems | 0.78-0.82 AUROC | Medium (LLM-as-judge) |
| G-Eval | Nuanced reasoning | 0.819 Recall | High (Expensive API calls) |
| HaluShift | Domain-specific (Legal/Med) | 89.9% AUCROC | Variable (Spectral analysis) |
The Core Metrics You Need in Your Dashboard
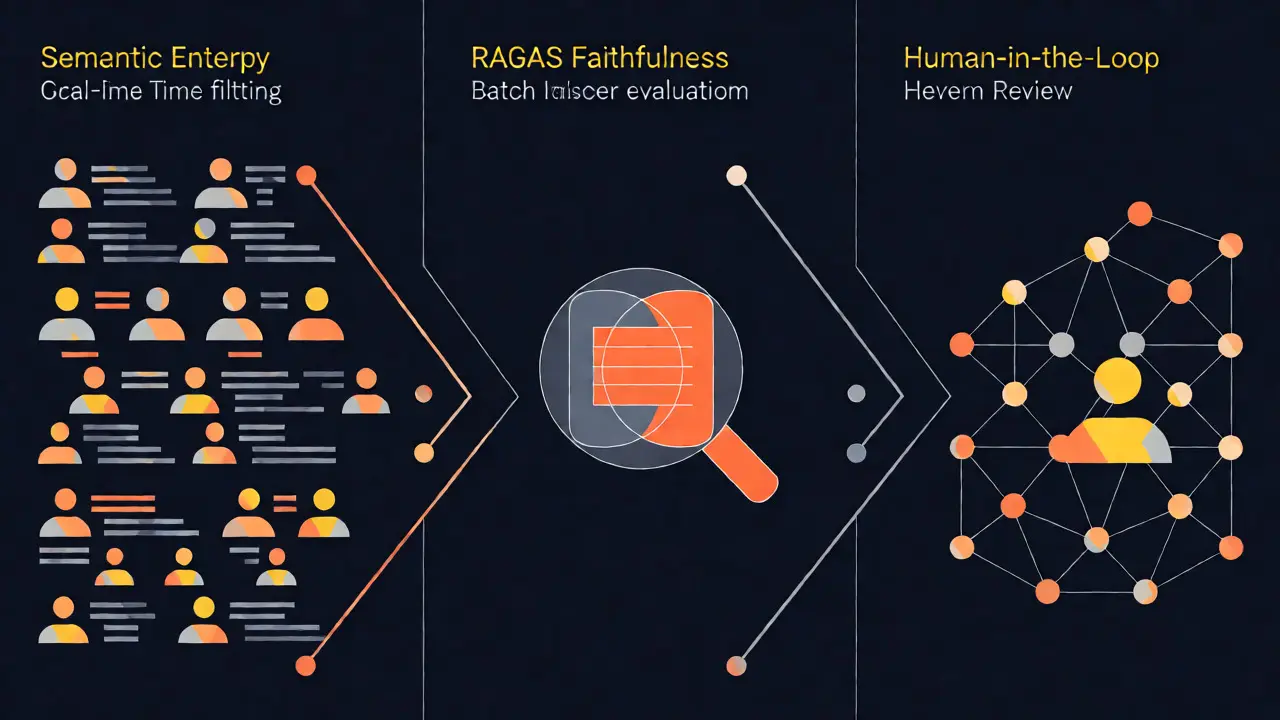
You can’t monitor everything all the time. That’s too slow and too expensive. Successful production systems use a tiered approach. Here are the three layers you need.
Layer 1: Real-Time Filtering with Semantic Entropy
This is your first line of defense. Semantic Entropy a method introduced in Nature (2024) that measures the uncertainty of an LLM's output by analyzing the consistency of multiple generated responses works by asking the model the same question multiple times. If the answers vary wildly in meaning, the entropy is high, and the model is likely guessing. A study published in Nature in April 2024 showed this method maintains consistent performance across model sizes from 7B to 70B parameters.
In practice, you run this on 100% of traffic. If the entropy score crosses a threshold (say, 0.65), you either reject the answer or flag it for review. Datadog’s implementation showed this approach had the smallest drop in accuracy between different benchmarks, making it robust for changing data distributions.
Layer 2: Batch Evaluation with RAGAS
You don’t need to judge every single query with an expensive LLM. Instead, sample 10-20% of your traffic for deeper analysis. Use RAGAS Faithfulness here. It uses an LLM-as-a-judge to break down the answer into individual claims and checks each one against the retrieved documents. If the score drops below 0.65, you have a problem. One healthcare startup found that scores below this threshold correlated with 92% of their regulatory compliance issues.
Layer 3: Human-in-the-Loop for Edge Cases
No automated system is perfect. Reserve human review for the top 1-2% of cases flagged by both entropy and RAGAS. This keeps costs manageable while catching the subtle errors that machines miss. OpenAI’s research notes that current metrics often miss "confident hallucinations"-where the model is wrong but sure about it. Humans catch these best.
Building the Dashboard: What to Track
A dashboard isn’t just a graph. It’s a decision engine. If you’re using tools like LangSmith, Patronus AI, or custom Grafana setups, here’s what needs to be front and center.
- Global Hallucination Rate: The percentage of all queries flagged as potentially false. Aim for <5% in mature systems. If it spikes above 15%, Microsoft’s internal studies show customer satisfaction plummets.
- False Positive Rate: How often does your detector cry wolf? If you block good answers, users get frustrated. Startups often prioritize recall (catching all errors), while enterprises prioritize precision (not blocking good answers).
- Latency Overhead: Measuring hallucination adds time. If your LLM-as-a-judge adds 350ms per request, is that acceptable? For real-time chat, probably not. For batch reports, yes.
- Domain-Specific Thresholds: Don’t use one number for everything. Financial data might need a stricter threshold (0.80) than creative marketing copy (0.60). Capital One’s case study showed optimal thresholds varied between 0.65 and 0.82 across different financial products.

Common Pitfalls and How to Avoid Them
Most teams fail at hallucination measurement not because the math is hard, but because the setup is wrong. Here are the traps I’ve seen repeatedly.
The "Too Low" Threshold Trap: When you first turn on monitoring, you’ll panic. You’ll see tons of flags. Most teams lower the threshold to reduce noise, accidentally letting bad answers through. Datadog’s data shows 63% of enterprise clients initially set thresholds too low, triggering excessive false positives that made the system feel unusable. Start strict, then loosen based on business impact, not just volume.
Ignoring Context Length Limits: RAGAS and other judge-based methods struggle when the context window is huge. If you’re feeding 100 pages of PDFs into the judge, it might miss key details. Confident AI’s survey found that 78% of respondents faced issues here. Solution? Chunk your context or summarize before judging.
Creative Content Mismatch: If you’re generating blog posts or ad copy, strict factuality metrics will kill your creativity. A media company CTO noted that current tools produced 22% false negatives on creative content because some fabrication is acceptable there. Separate your pipelines: one for factual QA (strict metrics), one for creative generation (looser metrics).
Implementation Roadmap for Q4 2026
So, how do you actually start? Don’t try to build everything at once. Follow this sequence.
- Week 1-2: Baseline with Semantic Entropy. Implement self-consistency checks on your existing logs. No new infrastructure needed. Just generate 3-5 variations of each answer and measure variance. Get your baseline error rate.
- Week 3-4: Add RAGAS Sampling. Pick 10% of traffic. Run them through RAGAS Faithfulness. Compare these results against your human-labeled gold standard set. Calibrate your thresholds.
- Month 2: Integrate Commercial Tools or Custom Judges. If open-source isn’t cutting it, look at Patronus AI or Confident AI. They offer better documentation and support for edge cases. Note that integration typically takes 40-60 hours for comprehensive monitoring.
- Ongoing: Regulatory Alignment. With the EU AI Act’s Article 15 taking full effect in January 2026, ensure your dashboard exports audit-ready logs. You need to prove you’re mitigating risk, not just tracking it.
Remember, the goal isn’t zero hallucinations. That’s impossible. The goal is known hallucinations. You want to know when your model is lying so you can decide whether to trust it, correct it, or escalate it.
What is a good hallucination rate for production?
It depends on your domain. For high-stakes fields like finance or healthcare, aim for under 2-5%. For general customer support, 5-10% might be acceptable if fallback mechanisms are in place. Microsoft’s studies suggest rates above 15% significantly hurt customer satisfaction.
Can I use BLEU or ROUGE to measure hallucinations?
No. These metrics measure n-gram overlap with reference text, not factual correctness. A model can paraphrase correctly (high BLEU) while inventing facts. Always use factuality-specific metrics like RAGAS Faithfulness or Semantic Entropy.
How much latency does hallucination detection add?
Semantic entropy adds minimal latency if optimized, but LLM-as-a-judge methods (like RAGAS) can add 300-500ms per request. For real-time apps, use entropy for immediate filtering and async judges for logging. For batch processing, latency matters less.
Do I need a commercial tool or can I use open source?
Open-source tools like RAGAS and DeepEval are great for starting out and cost nothing. However, 57% of teams report difficulties integrating them with existing stacks. Commercial APIs like Patronus AI offer better support and pre-calibrated thresholds, which can save weeks of engineering time.
How often should I recalibrate my thresholds?
Recalibrate whenever you change your base model, update your retrieval system, or shift your use case. Also, review monthly. As user queries evolve, the distribution of "normal" answers changes, requiring threshold adjustments to maintain accuracy.
- Oct, 30 2026
- Collin Pace
- 0
- Permalink
- Tags:
- LLM hallucination metrics
- RAG faithfulness
- semantic entropy
- production AI monitoring
- factuality control
Written by Collin Pace
View all posts by: Collin Pace