Measuring ROI for Large Language Model Initiatives: Metrics That Matter

Here is the hard truth about Large Language Models (LLMs): most companies are flying blind when it comes to calculating their return on investment. You have likely seen the hype. You have heard the claims of 10x productivity. But when you sit down with your CFO to justify the budget for an enterprise-grade generative AI initiative, vague promises don't cut it. You need numbers. You need a framework that connects technical performance directly to financial outcomes.
The landscape has shifted dramatically since the early experimentation days of 2022. According to a 2023 study by Deloitte, only 66% of companies implementing AI initiatives actually experience tangible ROI. The other third? They are burning cash on tools that look impressive in demos but fail to deliver measurable value in daily operations. This article breaks down exactly how to measure that value, moving beyond generic "productivity" buzzwords to specific, actionable metrics that matter for your bottom line.
The Core Problem: Why Traditional Metrics Fail
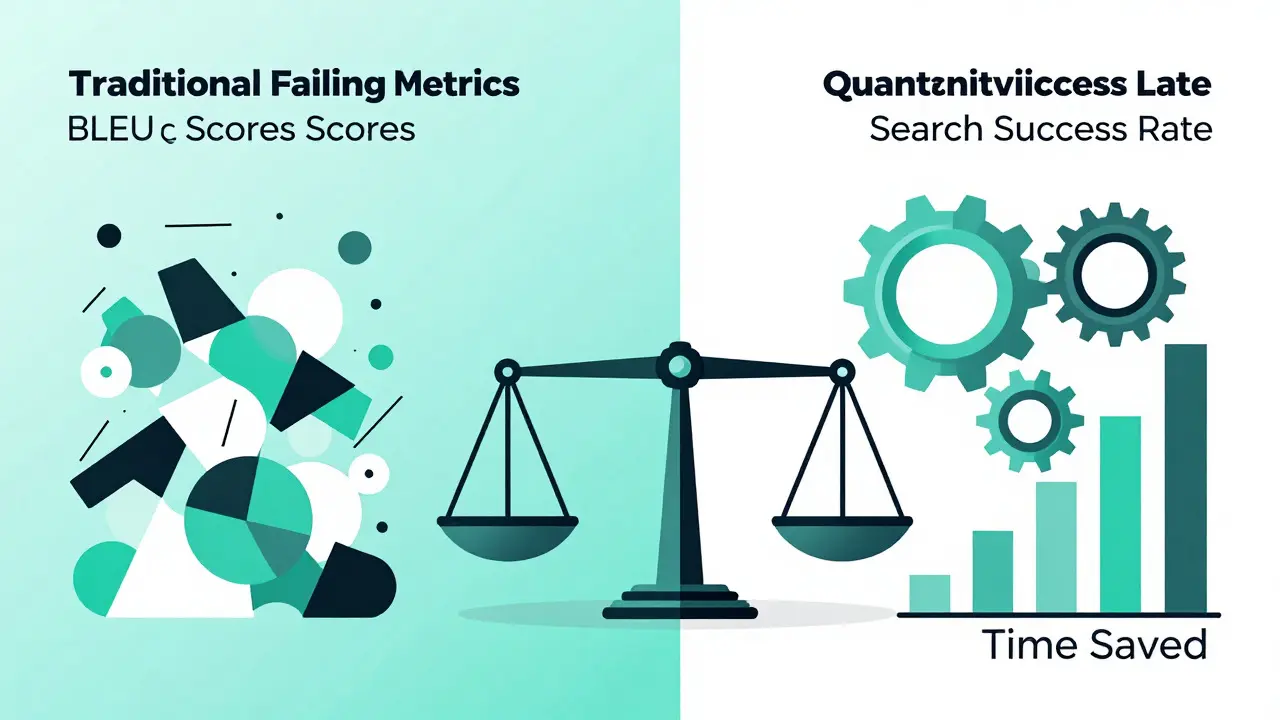
If you try to measure an LLM using traditional software metrics, you will get misleading results. Old-school benchmarks like BLEU and ROUGE scores were designed for machine translation, not for complex reasoning or semantic understanding. As noted by Agathon AI in their 2024 white paper, the rapid advancement of LLMs has outpaced these traditional evaluation methods. They simply cannot capture the nuance of a customer service response or the accuracy of a code generation task.
The core issue is that LLMs are probabilistic, not deterministic. A human evaluator might rate one answer as "good" and another as "great," but a rigid algorithm sees both as text strings. To fix this, we need to adopt a hybrid approach that combines quantitative data (speed, cost, error rates) with qualitative assessments (user satisfaction, relevance). This dual-layered measurement is the foundation of any robust AI governance strategy.
Quantitative Metrics: The Hard Numbers
Let’s start with what you can count. These are your "hard ROI KPIs," as IBM refers to them. They focus on labor cost reductions and operational efficiency gains. Without these, your ROI calculation is just guesswork.
- Search Success Rate: This is the percentage of queries that yield relevant results on the first attempt. In enterprise search implementations, baseline success rates often hover between 45-60%. Post-LLM implementation, successful projects see this jump to 80-90%. GoSearch’s 2024 analysis highlights that this metric is critical because every failed search costs time and money.
- Time Saved Per Query: Measure this in minutes. If a specialist previously spent 25 minutes finding data for a report, and an LLM-powered conversational interface reduces that to 2 minutes, you have saved 23 minutes per interaction. Multiply that by the number of users and interactions per week, and the savings become massive.
- User Adoption Rate: Technology is useless if no one uses it. Track the percentage of employees actively using the new platform. Low adoption often signals poor integration or lack of trust in the model's outputs.
- Hallucination Rate: Defined by Confident AI as the percentage of outputs containing fabricated information. For high-stakes industries like healthcare or finance, this must be near zero. Even a 1% hallucination rate can lead to costly errors or reputational damage.
Qualitative Metrics: The Human Element
Numbers tell half the story. The other half is how people feel about the tool. These "soft ROI KPIs" are often overlooked but are vital for long-term sustainability. If your team hates the tool, they will find workarounds, negating any efficiency gains.
Consider Contextual Relevancy, scored on a 0-1 scale for Retrieval-Augmented Generation (RAG) systems. Does the answer actually address the user's intent, or does it just sound smart? Then there is Tool Correctness, which measures the percentage of correct tool calls made by LLM agents. If an agent is supposed to book a meeting but instead sends an email, the tool correctness is low, even if the language output was perfect.
User feedback from early adopters reveals consistent themes. A technology company executive shared on Reddit in March 2024 that their team now finds what they need in 2 minutes instead of 10, saving 32 hours weekly across 50 knowledge workers. But more importantly, data teams reported a 70% reduction in repetitive questions, allowing them to focus on higher-value tasks. This shift in job satisfaction and strategic focus is a key intangible benefit that should be quantified wherever possible.
Calculating Financial ROI: A Real-World Example
Let’s put this into practice with a concrete example from Bluesoft’s 2024 case study. They implemented a conversational data access solution for a European enterprise with 50 data users and a 5-person support team. Here is how they broke down the ROI:
| Metric | Value |
|---|---|
| Initial Investment | €20,000 (approx. 20,000 PLN) for two engineers over two weeks |
| Users | 50 data specialists |
| Queries per User/Week | 2 questions |
| Time Saved per Query | 25 minutes (from manual search to instant answer) |
| Hourly Specialist Rate | €50 |
| Working Weeks per Year | 50 |
| Annual Token Costs | €50 (negligible compared to labor savings) |
| Annual Savings Calculation | (50 users × 2 queries × 25 mins × 50 weeks × €50/hr) / 60 = €128,000 |
| First-Year ROI | 93% |
This example illustrates a crucial point: token costs are significantly lower than the cost of manual work hours. IBM’s 2024 analysis confirms that while compute costs exist, they pale in comparison to the value of reclaimed human capital. However, note that this ROI assumes high adoption and accurate answers. If the hallucination rate is high, those "saved" minutes are lost to verification efforts.
Sector-Specific Variations and Benchmarks
Not all industries reap the same rewards. The ROI potential varies significantly based on the nature of the work and the tolerance for error. Techstack’s 2024 analysis of an AI platform in healthcare showed a staggering 451% ROI over five years, increasing to 791% when radiologist time savings were included. Why such a huge difference? Because in healthcare, time is literally life, and the volume of unstructured data is immense.
In contrast, manufacturing companies may see lower initial returns if they focus only on support ticket reduction. A Capterra review from June 2024 highlighted a manufacturing firm that reported a disappointing 15% ROI because they ignored productivity gains in downstream processes. They measured only implementation costs against reduced IT tickets, missing the bigger picture of faster production planning and inventory management.
Adoption rates also vary by sector. IDC’s May 2024 report shows technology companies leading at 78% implementation rates, followed by financial services at 62% and healthcare at 54%. When setting your expectations, benchmark against peers in your specific vertical, not the tech giants.

Pitfalls to Avoid in Measurement
Even with the right metrics, you can still fail. Here are the most common traps:
- No Baseline Measurement: You cannot measure improvement if you don’t know where you started. Techstack’s guide emphasizes establishing baseline metrics before implementation. Did your team spend 10 or 20 minutes on average per search? Guessing leads to inflated ROI claims.
- Ignoring Integration Complexity: Gartner’s Q2 2024 survey found that 42% of organizations required 3-6 months to fully integrate LLM solutions into existing workflows. During this period, productivity may dip. Factor this learning curve into your timeline.
- Data Quality Issues: IBM’s 2024 survey revealed that 68% of organizations cite data quality as the primary barrier to accurate ROI measurement. Garbage in, garbage out. If your RAG system is pulling from outdated or messy databases, your success rates will suffer.
- Overestimating Automation: Many leaders assume LLMs will replace humans entirely. In reality, they augment them. Plan for a human-in-the-loop model, especially for high-risk decisions. This affects your cost structure and training requirements.
Future Trends: Standardization and Real-Time Dashboards
The field is maturing rapidly. Kanerika’s 2024 forecast predicts the emergence of standardized ROI calculation frameworks specific to generative AI by 2025. We are moving away from ad-hoc spreadsheets toward integrated platforms. IBM released an AI ROI calculator in October 2024 that incorporates Net Present Value (NPV) methodology with adjustable discount rates for different industry sectors.
Looking ahead to 2025-2026, expect to see real-time ROI dashboards that connect LLM performance metrics directly to financial outcomes. Multiple enterprise AI vendors announced this capability at AWS re:Invent 2024. Gartner predicts that by 2026, 75% of successful LLM implementations will use industry-specific ROI metrics rather than generic productivity measures. McKinsey’s December 2024 analysis supports this, projecting that organizations using comprehensive frameworks will achieve 2.3× higher returns than those relying on intuition.
Next Steps for Your Organization
To start measuring your LLM ROI effectively, follow these steps:
- Define Clear Use Cases: Don’t boil the ocean. Start with high-value, contained problems like internal search or customer support triage.
- Establish Baselines: Spend two weeks tracking current times, costs, and error rates for these processes.
- Select Key Metrics: Choose 3-5 metrics from the lists above that align with your business goals. For example, if speed is critical, prioritize Time Saved and Search Success Rate.
- Implement Monitoring: Use tools like Confident AI or Galileo to track hallucination rates and contextual relevancy in real-time.
- Review and Iterate: Conduct quarterly reviews. Adjust your prompts, refine your data pipelines, and update your ROI calculations based on actual usage data.
Remember, the goal isn’t just to prove the technology works. It’s to demonstrate sustainable value. By focusing on these specific metrics, you move from speculative hype to strategic governance, ensuring your LLM initiatives deliver real, measurable results.
What is the most important metric for measuring LLM ROI?
While multiple metrics are needed, Search Success Rate and Time Saved Per Query are often the most impactful for enterprise applications. These directly correlate to labor cost savings and productivity gains, providing clear financial justification for the investment.
How do I account for the cost of LLM tokens in my ROI calculation?
Token costs are typically negligible compared to labor savings. IBM’s 2024 analysis notes that token pricing is significantly lower than manual work hours. Include annual token costs as a minor operational expense, but focus your ROI calculation on the value of reclaimed human time and increased throughput.
Why did my LLM project fail to show positive ROI?
Common reasons include lack of baseline measurements, poor data quality, low user adoption, or measuring only direct cost reductions while ignoring broader productivity gains. Ensure you have established baselines before implementation and track both hard and soft KPIs.
What is the difference between hard and soft ROI KPIs?
Hard ROI KPIs are quantifiable financial metrics like labor cost reduction and time savings. Soft ROI KPIs are intangible benefits such as employee satisfaction, improved decision-making quality, and enhanced customer experience. Both are essential for a complete picture of value.
How long does it take to see ROI from an LLM implementation?
Most organizations see initial productivity gains within 2-4 months, but full ROI realization may take 6-12 months due to integration complexity and user learning curves. Gartner reports that 42% of organizations require 3-6 months for full workflow integration.
Are there industry-specific standards for LLM ROI measurement?
Currently, no universal standard exists, but specialized frameworks are emerging. Kanerika predicts standardized generative AI ROI frameworks by 2025. For now, best practices involve adapting general metrics to industry-specific contexts, such as including radiologist time savings in healthcare ROI calculations.
- Jul, 31 2026
- Collin Pace
- 5
- Permalink
- Tags:
- LLM ROI metrics
- enterprise AI measurement
- LLM cost savings
- AI governance strategy
- generative AI evaluation
Written by Collin Pace
View all posts by: Collin Pace