Observability and SRE Practices for Self-Hosted Large Language Models

Running your own large language models feels like keeping a high-performance sports car in your garage. You have the engine, you have the fuel, but if you don't know how to read the dashboard lights, one wrong move can leave you stranded. For teams moving away from managed APIs to self-hosted infrastructure, the gap between "it works on my laptop" and "it stays up at scale" is where most projects fail.
The core problem isn't just serving tokens; it's knowing exactly why latency spiked, why GPU memory leaked, or why a specific prompt caused a crash. Traditional monitoring tools track CPU and RAM, but they are blind to the internal state of an AI model. This article breaks down how to build an observability stack that actually sees what's happening inside your self-hosted LLMs, using proven Site Reliability Engineering (SRE) practices.
Why Traditional Monitoring Fails with Self-Hosted LLMs
When you host a standard web application, you monitor HTTP status codes and response times. If a request takes too long, you check the database query logs. It’s linear and predictable. Self-hosted Large Language Models are complex neural networks that process natural language inputs to generate text outputs, requiring specialized hardware like GPUs and unique operational metrics beyond standard infrastructure monitoring. They do not behave like standard applications.
An LLM might respond quickly but return nonsense. It might hang because the context window is full, not because the server is overloaded. Or it might crash silently due to a CUDA out-of-memory error that traditional system monitors miss until it’s too late. The lack of standardization in this space means there is no single "right way" to monitor these systems yet. Many teams try to apply old DevOps habits to new AI problems and end up with blind spots.
The key difference lies in the nature of the workload. Inference is bursty and resource-intensive. A single user asking a complex question might consume more compute power than a thousand users loading a static webpage. If your observability stack doesn't account for this variance, you will either over-provision (wasting money) or under-provision (causing outages).
Essential Metrics for LLM Observability
To gain visibility into your self-hosted models, you need to look deeper than the operating system level. Most modern inference engines, such as vLLM is a high-throughput and memory-efficient inference and serving engine for Large Language Models that exposes critical performance metrics via Prometheus for real-time monitoring, expose specific metrics designed for this purpose. You should configure your monitoring system, typically Prometheus is an open-source systems monitoring and alerting toolkit originally built at SoundCloud, widely used in Kubernetes environments to scrape and store time-series metric data, to capture these signals immediately.
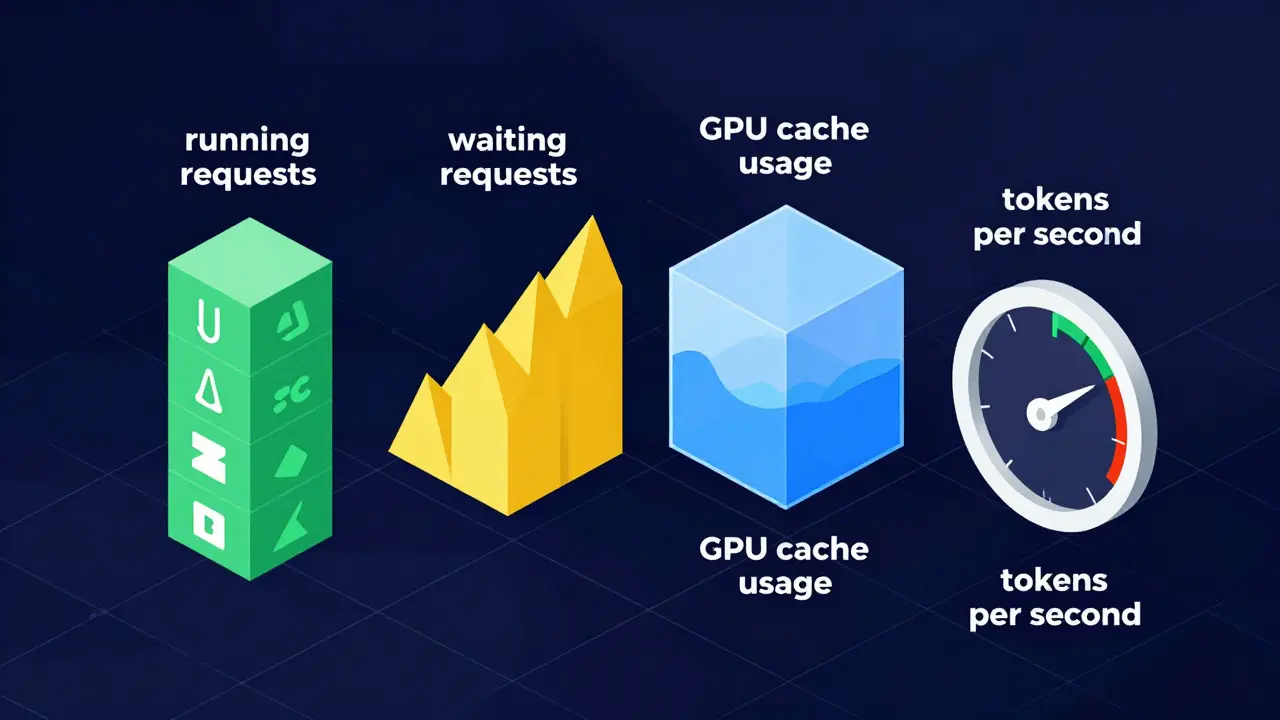
Here are the four non-negotiable metrics you must track:
- vllm_num_requests_running: This tells you how many requests are currently being processed by the GPU. If this number hits your maximum parallel limit, new requests will queue up.
- vllm_num_requests_waiting: This measures the backlog. A growing wait queue indicates you are undersized for the current load. High wait times kill user experience faster than slow generation speeds.
- vllm_gpu_cache_usage_perc: GPU memory is the bottleneck. This metric shows how much of the KV cache is utilized. If this approaches 100%, the system may start evicting context or failing entirely.
- vllm_avg_generation_throughput_toks_per_s: This measures speed. Tracking tokens per second helps you identify when model complexity or context length is dragging down performance.
In a Kubernetes environment, you create a ServiceMonitor object to tell Prometheus to scrape these endpoints automatically. Without this step, you are flying blind. You might see that the pod is "running," but you won't know that it's stuck processing a single massive request while ten others time out.
The Reality Check: Can LLMs Monitor Themselves?
A popular idea in 2025 and early 2026 was that we could use AI to fix AI. The theory was simple: feed observability data into an LLM, let it analyze the logs, and have it diagnose the root cause autonomously. It sounds efficient, but reality has been harsher.
ClickHouse conducted a comprehensive experiment in 2026 testing this exact scenario. They deployed the OpenTelemetry demo application, instrumented it with ClickStack in Kubernetes, and generated synthetic anomalies. They then asked advanced models, including GPT-5, to identify the root causes using a naive prompt: "You're an Observability agent... can you identify what is the issue, the root cause and suggest potential solutions?"
The results were clear: autonomous root cause analysis (RCA) using LLMs is not yet viable. Even the most advanced models failed to consistently outperform manual investigation by experienced SREs. Some models went off track, requiring significant human guidance to stay on topic. Others hallucinated connections between unrelated events.
This doesn't mean LLMs are useless in SRE. It means they are assistants, not replacements. The best practice emerging from this research is to use LLMs to summarize findings, draft incident reports, or suggest next steps based on structured data. But the engineer must remain in the loop. Trusting an LLM to autonomously restart pods or adjust scaling thresholds in a production environment is a risk most organizations cannot afford right now.
SRE Strategies for Kubernetes-Based LLM Deployments
Self-hosting usually means running on Kubernetes. This adds a layer of complexity because your LLM is just another container, competing for resources with databases, caches, and microservices. SRE practices here focus on stability and predictability.
Resource Right-Sizing Traditional autoscaling looks at CPU and memory. For LLMs, you need custom metrics. You should configure Horizontal Pod Autoscalers (HPA) to react to `vllm_num_requests_waiting` rather than just CPU usage. If the queue grows, scale out. If the GPU cache usage drops below a certain threshold during low traffic, scale in. This prevents both bottlenecks and wasted spend.
Failure Diagnosis and Recovery LLMs fail in unique ways. A common issue is the OOMKilled state, where the GPU runs out of memory. Instead of waiting for alerts, implement proactive health checks. Use liveness probes that check not just if the port is open, but if the model can accept a lightweight ping request. If the probe fails, Kubernetes kills and restarts the pod. However, restarting a large model takes minutes. To mitigate this, consider using warm standby pods or predictive scaling based on historical usage patterns.
Log Correlation Logs from LLMs can be noisy. Combine them with traces from OpenTelemetry. When a user reports a slow response, you should be able to trace that request from the API gateway, through the Kubernetes ingress, into the vLLM container, and see exactly how many tokens were generated and how long each step took. This end-to-end visibility is crucial for debugging performance issues.
| Aspect | Traditional Web App | Self-Hosted LLM |
|---|---|---|
| Primary Bottleneck | CPU / Database I/O | GPU Memory / VRAM |
| Key Metric | HTTP Response Time | Tokens Per Second / Queue Depth |
| Scaling Trigger | CPU Usage > 70% | Waiting Requests > Threshold |
| Failure Mode | 500 Errors / Timeouts | OOMKilled / Hallucination / Degraded Quality |
| Observability Tool | Standard APM (New Relic, Datadog) | Specialized (Openlit, OneUptime, Prometheus + vLLM) |
Emerging Trends: AI-Native Automation
While fully autonomous RCA is still immature, the industry is moving toward "AI-Native Kubernetes." This involves integrating machine learning models directly into the control loops of your infrastructure. As of mid-2026, several capabilities are becoming available in enterprise platforms.
Autopilot Scaling Instead of static rules, ML models analyze historical workload patterns to predict demand. They adjust replica counts before the spike happens. This reduces cold-start latency, which is critical for LLMs that take time to load weights into memory.
Smart Sizing Vertical scaling is hard to guess. Smart sizing tools continuously analyze actual CPU and memory usage versus requested limits. They recommend or automatically adjust resource requests to optimize cost without sacrificing performance. For LLMs, this includes tuning GPU memory reservations to prevent fragmentation.
Pod Recovery AI This feature analyzes failure events like crash loops. It correlates logs and metrics to diagnose the issue. While it may not fix it autonomously yet, it can suggest precise remediation steps, such as "Increase GPU memory limit by 2GB" or "Update image to patch version X." This drastically reduces Mean Time to Resolution (MTTR) for on-call engineers.
Building Your LLMOps Checklist
If you are starting from scratch, do not try to boil the ocean. Start with these foundational steps to establish basic observability and reliability.
- Instrument Your Serving Framework: Ensure vLLM or your chosen engine is exposing Prometheus metrics. Verify you can see `vllm_num_requests_running` and `vllm_gpu_cache_usage_perc` in your Grafana dashboards.
- Set Up Alerting Thresholds: Create alerts for high queue depths (>10 requests waiting) and GPU cache usage (>90%). These are leading indicators of instability.
- Implement Distributed Tracing: Use OpenTelemetry to trace requests across your entire stack. Connect the frontend API call to the backend LLM inference step.
- Define SLIs and SLOs: Decide what "good" looks like. Is it 99% of responses under 2 seconds? Is it 99.9% availability? Write these down and measure against them.
- Practice Incident Response: Simulate failures. Kill a pod. Spike the load. See how your monitoring reacts. Do you get alerted? Does the auto-scaler kick in? Fix the gaps before real users suffer.
Remember, LLMOps is distinct from traditional MLOps. It requires a blend of infrastructure engineering and AI understanding. By focusing on the right metrics and maintaining human oversight in your automation strategies, you can build a robust, observable, and reliable self-hosted LLM infrastructure.
What is the difference between LLMOps and MLOps?
MLOps focuses on the lifecycle of training and deploying smaller, traditional machine learning models. LLMOps deals specifically with Large Language Models, which involve different challenges like massive GPU memory requirements, token-based throughput metrics, and quality assessment of generated text rather than just prediction accuracy. LLMOps also emphasizes runtime observability of inference services more heavily.
Can I use standard APM tools like Datadog or New Relic for LLM monitoring?
Standard APM tools can monitor the infrastructure (CPU, RAM, network), but they often lack native support for LLM-specific metrics like token generation speed or KV cache usage. You may need to integrate specialized agents or use dedicated LLMOps platforms like Openlit or OneUptime alongside your existing stack to get full visibility.
How do I handle GPU out-of-memory errors in Kubernetes?
Configure appropriate resource limits and requests for your pods. Use liveness probes to detect unresponsive states caused by OOM conditions. Implement auto-scaling based on queue depth to distribute load before any single pod gets overwhelmed. Consider using techniques like PagedAttention (used by vLLM) to manage memory more efficiently.
Is it safe to let LLMs automatically fix production issues?
Currently, no. Research from 2026 shows that autonomous root cause analysis by LLMs is not yet reliable enough for production environments. LLMs can hallucinate solutions or misinterpret complex log correlations. Use them as assistants to suggest fixes or summarize incidents, but keep human engineers in the decision loop for critical actions.
What metrics are most important for vLLM monitoring?
The most critical metrics are vllm_num_requests_running (active processing), vllm_num_requests_waiting (queue backlog), vllm_gpu_cache_usage_perc (memory pressure), and vllm_avg_generation_throughput_toks_per_s (performance speed). These provide a complete picture of load, capacity, and efficiency.
- Jun, 30 2026
- Collin Pace
- 0
- Permalink
Written by Collin Pace
View all posts by: Collin Pace